returns information function, expected score function, score simulation function, or score distribution for a single item, an arbitrary group of items or all items
information(
  parms,
  items = NULL,
  booklet_id = NULL,
  parms_draw = c("average", "sample")
)

expected_score(
  parms,
  items = NULL,
  booklet_id = NULL,
  parms_draw = c("average", "sample")
)

r_score(
  parms,
  items = NULL,
  booklet_id = NULL,
  parms_draw = c("average", "sample")
)

p_score(
  parms,
  items = NULL,
  booklet_id = NULL,
  parms_draw = c("average", "sample")
)
Arguments
- parms
object produced by
fit_enormor a data.frame with columns item_id, item_score and, depending on parametrization, a column named either beta/delta, eta or b- items
vector of one or more item_id's. If NULL and booklet_id is also NULL, all items in parms are used
- booklet_id
id of a single booklet (e.g. the test information function), if items is not NULL this is ignored
- parms_draw
when the item parameters are estimated with method "Bayes" (see:
fit_enorm), parms_draw specifies whether to use a sample (a different item parameter draw for each output column) or the posterior mean of the item draws. Alternatively, it can be an integer specifying a specific draw. It is ignored when parms is not estimated Bayesianly.
Value
Each function returns a new function which accepts a vector of theta's. These return the following values:
- information
an equal length vector with the information estimate at each value of theta.
- expected_score
an equal length vector with the expected score at each value of theta
- r_score
a matrix with length(theta) rows and one column for each item containing simulated scores based on theta. To obtain test scores, use rowSums on this matrix
- p_score
a matrix with length(theta) rows and one column for each possible sumscore containing the probability of the score given theta
Examples
db = start_new_project(verbAggrRules,':memory:')
add_booklet(db,verbAggrData, "agg")
#> no column `person_id` provided, automatically generating unique person id's
#> $items
#>  [1] "S1DoCurse"   "S1DoScold"   "S1DoShout"   "S1WantCurse" "S1WantScold"
#>  [6] "S1WantShout" "S2DoCurse"   "S2DoScold"   "S2DoShout"   "S2WantCurse"
#> [11] "S2WantScold" "S2WantShout" "S3DoCurse"   "S3DoScold"   "S3DoShout"
#> [16] "S3WantCurse" "S3WantScold" "S3WantShout" "S4DoCurse"   "S4DoScold"
#> [21] "S4DoShout"   "S4WantCurse" "S4WantScold" "S4WantShout"
#>
#> $person_properties
#> character(0)
#>
#> $columns_ignored
#> [1] "gender" "anger"
#>
p = fit_enorm(db)

# plot information function for single item

ifun = information(p, "S1DoScold")

plot(ifun,from=-4,to=4)


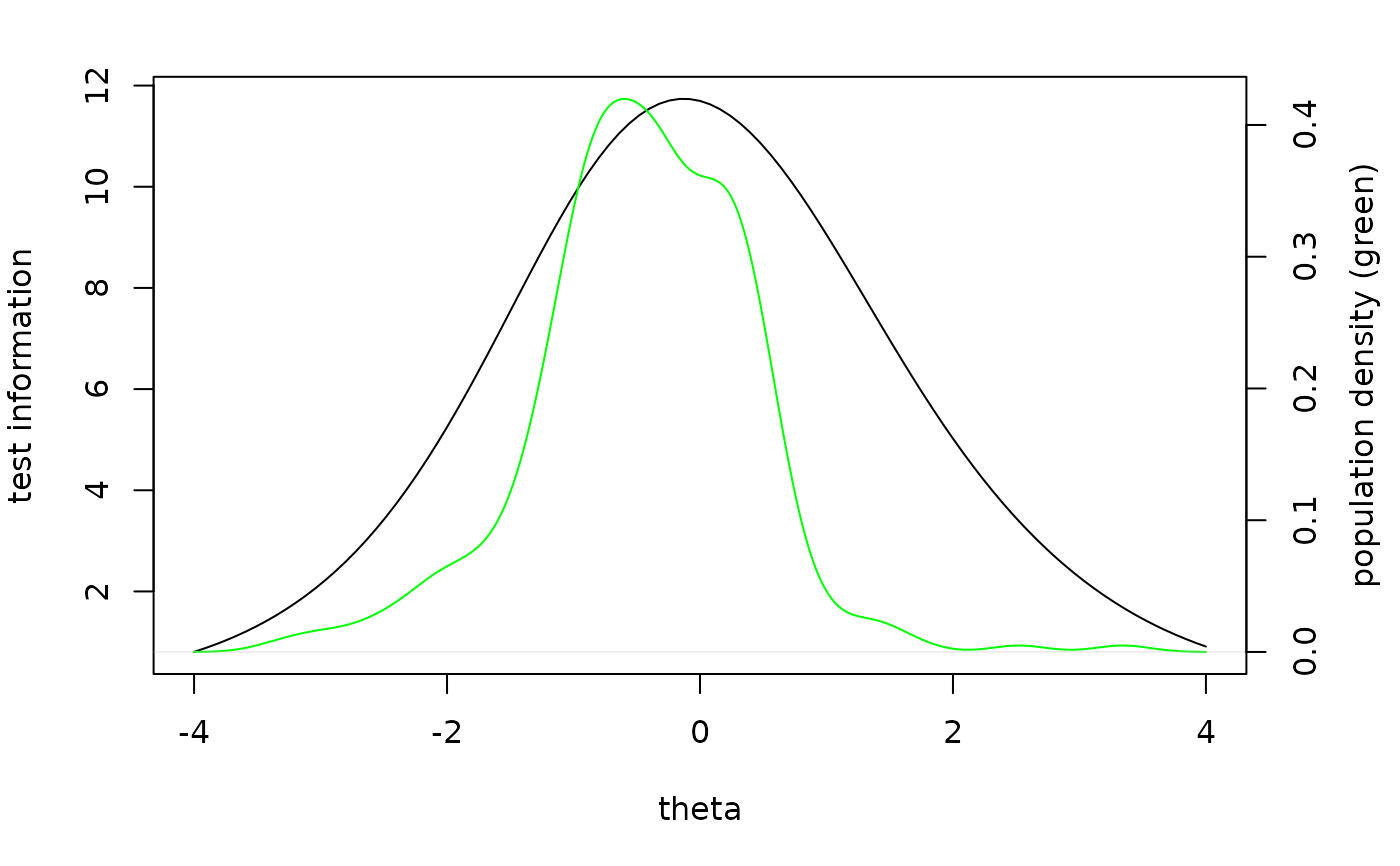
# compare test information function to the population ability distribution

ifun = information(p, booklet="agg")

pv = plausible_values(db,p)


oldpar = par(mar = c(5,4,2,4))

plot(ifun,from=-4,to=4, xlab='theta', ylab='test information')

par(new=TRUE)

plot(density(pv$PV1), col='green', axes=FALSE, xlab=NA, ylab=NA, main=NA)
axis(side=4)
mtext(side = 4, line = 2.5, 'population density (green)')


par(oldpar)
close_project(db)