Compare how subgroups attain a test score with respect to an item property. Note: this function works for complete data (i.e. a single booklet/test form). If incomplete data is supplied, it will attempt to make a profile plot only for those items that were administered to all respondents.
profile_plot(
  dataSrc,
  item_property,
  covariate,
  predicate = NULL,
  model = c("IM", "RM"),
  x = NULL,
  col = NULL,
  col.diagonal = "lightgray",
  ...
)
Arguments
- dataSrc
a connection to a dexter database or a data.frame with columns: person_id, item_id, item_score and the item_property and the covariate of interest.
- item_property
The name of the item property defining the domains. The item property should have exactly two distinct values in your data
- covariate
name of the person property used to create the groups. There will be one line for each distinct value.
- predicate
An optional expression to filter data, if NULL all data is used
- model
"IM" (default) or "RM" where "IM" is the interaction model and "RM" the Rasch model. The interaction model is the default as it fits the data better or at least as good as the Rasch model.
- x
Which category of the item_property to draw on the x axis, if NULL, one is chosen automatically
- col
vector of colors to use for plotting
- col.diagonal
color of the diagonal lines representing the testscores
- ...
further graphical arguments to plot. Graphical parameters for the legend can be postfixed with
.legend
Details
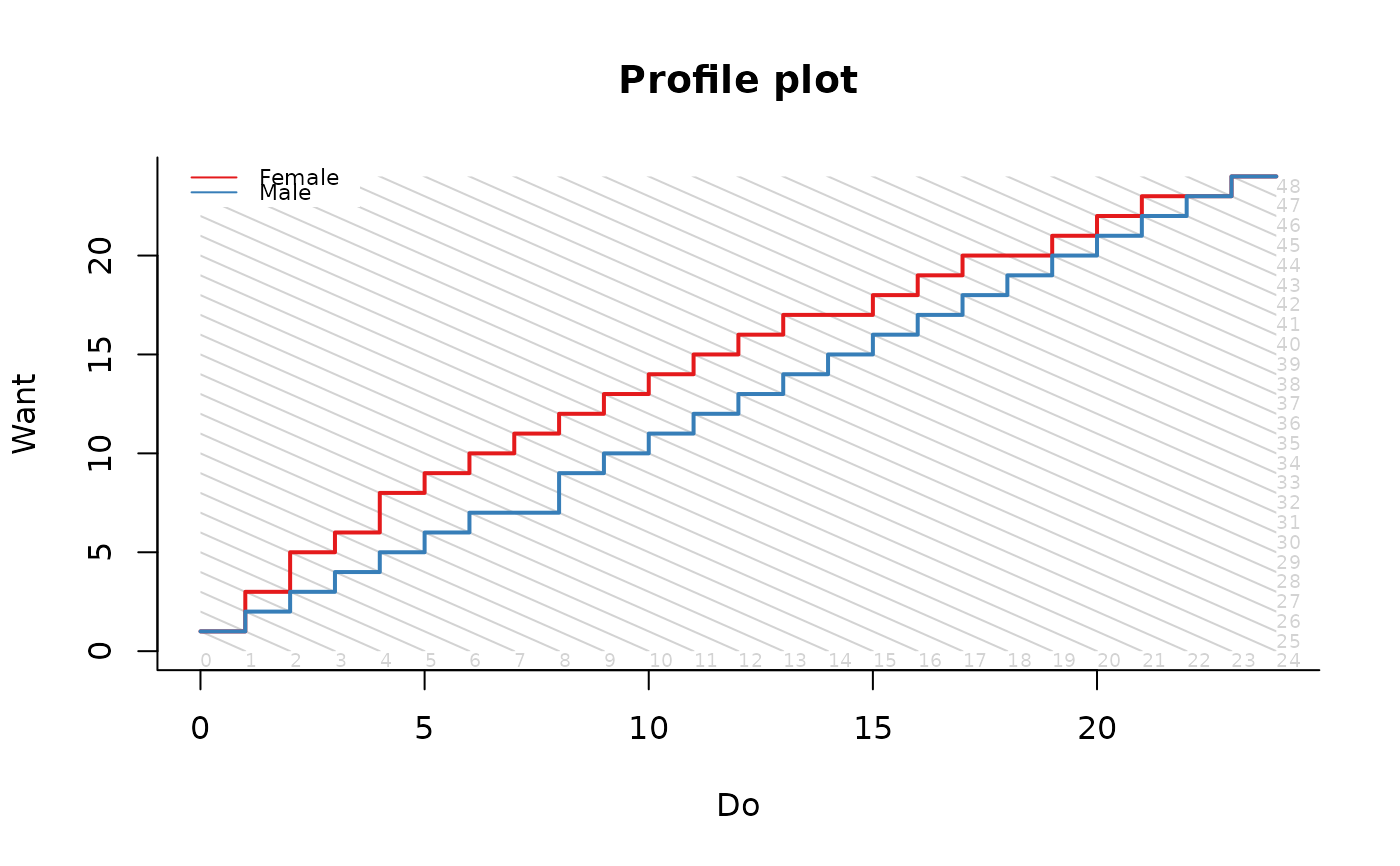
Profile plots can be used to investigate whether typically two, but possibly more, groups of respondents attain the same test score in the same way. The user must provide a meaningful classification of the items in two non-overlapping subsets such that the test score is the sum of the score on the subsets. The plot shows the expected scores on each subset of items given the test score, with diagonal lines indicating the same test score. The colored lines connect the most likely combination for each test score in each group. When applied to educational test data, the plots can be used to detect differences in the relative difficulty of (sets of) items for respondents that belong to different groups. This provides a content-driven way to investigate differential item functioning.
Examples
db = start_new_project(verbAggrRules, ":memory:",
                         person_properties=list(gender="unknown"))
add_booklet(db, verbAggrData, "agg")
#> no column `person_id` provided, automatically generating unique person id's
#> $items
#>  [1] "S1DoCurse"   "S1DoScold"   "S1DoShout"   "S1WantCurse" "S1WantScold"
#>  [6] "S1WantShout" "S2DoCurse"   "S2DoScold"   "S2DoShout"   "S2WantCurse"
#> [11] "S2WantScold" "S2WantShout" "S3DoCurse"   "S3DoScold"   "S3DoShout"
#> [16] "S3WantCurse" "S3WantScold" "S3WantShout" "S4DoCurse"   "S4DoScold"
#> [21] "S4DoShout"   "S4WantCurse" "S4WantScold" "S4WantShout"
#>
#> $person_properties
#> [1] "gender"
#>
#> $columns_ignored
#> [1] "anger"
#>
add_item_properties(db, verbAggrProperties)
#> 4 item properties for 24 items added or updated.
profile_plot(db, item_property='mode', covariate='gender')


close_project(db)